
Chat2 Heat Maps
See how visitors really experience your website
Clicks | Scrolling | Time on Page | Drop-Off Insights | Referral Tracking
What are Chat2 Heat Maps?
Website insight that helps you improve performance
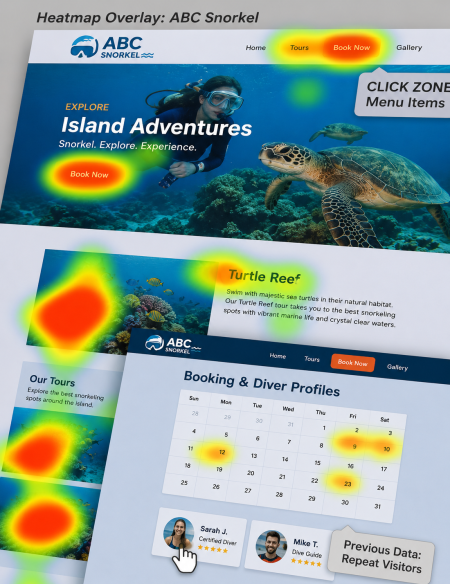
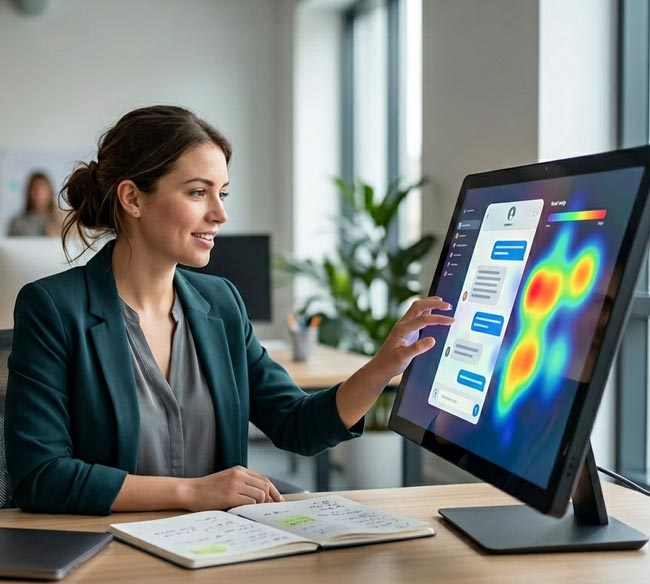
Chat2 Heat Maps helps businesses understand how visitors actually use their website. Instead of guessing what is working, you can see how people move through key pages, where they click, how often they click, how far they scroll, and where they may be getting stuck.
It gives you a clearer view of visitor behaviour so you can identify friction points, improve user experience, and make better decisions to support stronger conversions.
Quick and Easy to Implement
Chat2 Heat Maps is designed to be easy to add to your website and simple to start using.
Once installed, it begins capturing valuable behavioural insight across your website. From there, you can review how visitors are engaging with your online presence, where they are showing strong intent, and where they may be losing momentum before taking the next step.
It is a practical way to improve website performance using real visitor behaviour rather than assumptions.
How Chat2 Heat Maps Work

We install the tracking on your website
The heat mapping tool is added to your website so visitor behaviour can begin to be measured.

Visitor activity is captured
The system tracks how users interact with your pages, including clicks, scroll behaviour, mouse activity and time spent on page.

Behaviour patterns are revealed
You can see where users click, how often they click, where they hesitate, and where friction may be affecting the customer journey.

Drop-off and abandonment points become clearer
Track what users were doing just before they abandoned a cart, left a page, or stopped progressing through the journey.

You use the insight to improve performance
Use the data to refine your content, calls to action, layout and page structure to support stronger enquiry, booking or sales outcomes.
Why businesses choose Chat2 Heat Maps
Chat2 Heat Maps helps businesses turn website behaviour into practical insight that can support better decisions and stronger results.
See what is attracting attention
Understand which content, sections and calls to action are drawing engagement.
Identify friction points
Spot where visitors are hesitating, repeatedly clicking, or leaving before taking action
Understand abandonment behaviour
See what users were doing just before abandoning a cart, dropping off, or leaving the page
Improve the customer journey
Use real behaviour data to strengthen enquiry, booking and sales pathways.
Make better website decisions
Base updates on actual visitor behaviour rather than guesswork.
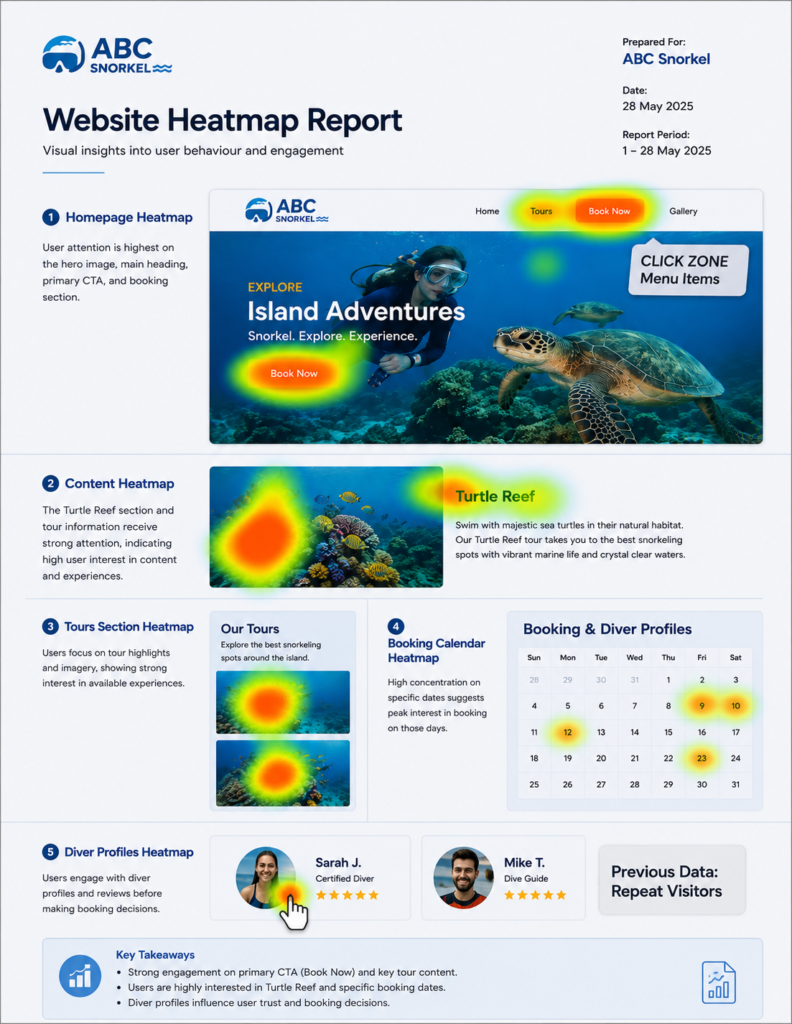
Example report of the type of data received.
What Chat2 Heat Maps shows you
Real insight into how visitors behave on your website
Chat2 Heat Maps can provide an interactive view of:
- Where a user clicks
- How often a user clicks
- Rage clicks or repeated clicks - showing where users may be frustrated or expecting something to happen
- Time spent on page
- Scrolling and mouse activity
- DOM tracking, event tracking and output tracking - this helps show what users were doing on the page just before they dropped off, abandoned a cart, or stopped moving through the journey
- What happened just before a user dropped off or abandoned cart
- Referral source, showing where visitors came from before landing on your website
This helps you move beyond basic traffic data and understand what users are actually doing on the page.
Works well alongside Chat2 products
Chat2 Heat Maps is especially valuable when used alongside other Chat2 products, helping your business understand how visitors behave before they engage through live chat or your chatbot.
It adds another layer of insight to your customer communication and conversion strategy.
Ideal for multiple industries
Chat2 Heat Maps works well across tourism and hospitality, ecommerce, real estate, finance, education and training, health and fitness, clubs and entertainment, festivals and events, information and directory services, and more.
It is especially useful for businesses wanting a clearer view of how their website is being used and where there may be opportunities to improve performance.
